DESIGNED FOR MICROSOFT BUSINESS INTELLIGENCE SOLUTIONS

Data intelligence for smart organizations

Platform Diagram Dark (1)
Data Vizioner Platform
With all of your data sources connected in one place, you'll get a bird's eye view of your data estate along with the detail needed to build trust and confidence in your data across the organization. Empower decision makers with good data.

Enhance governance

Democratization of data means putting a new lens on data governance. Understand where data may be exposed, improve regulatory compliance and mitigate risk as your workforce changes and you transform digitally.
Governance

Improve data quality

See where data is coming from and how it is being used to get insights into gaps and opportunities.

Improve compliance

Standardise datasets and reports prepared internally and externally to manage risk and reduce cost.

Apply best practices

Make everyone in your team a high performer. With a single click download an improved version.

Audit permissions

Improve row level security with insights into accessibility by role, and quickly check expressions.

SEE IT IN ACTION

Everything you need to know about Data Vizioner in less than 10 minutes! Have questions? We're ready to help.

Accelerate analysis

Data is increasingly complex. From impact analysis to migrations and review processes, you need to be able to diagnose problems fast, optimize your model and reduce the risk of costly mistakes before they happen.
Analysis

Breakdown reports

See how your report is constructed and filter pages and visuals by measures, columns and hierarchies.

Visualise models

At a glance see active and inactive table relationships, as well as cardinality and storage mode.

Track dependencies

View field expression dependancies visually, and explore table and role expression dependancies.

Review expressions

Easily see how DAX expressions are used throughout your model to spot and resolve issues fast.

Re-use queries

Put Power Query in focus. Compare, copy and download to improve data automation speed and accuracy.

See relationships

Get visibility of used and unused tables and fields to better understand your dataset.

Optimise your model

Act on insights around your data set to remove unused tables and fields to improve performance.

Analyse thin reports

Combine reports and datasets for raw insights into relationships with fast CSV exports.


trajan-cover

CASE STUDY

Trajan Scientific and Medical 

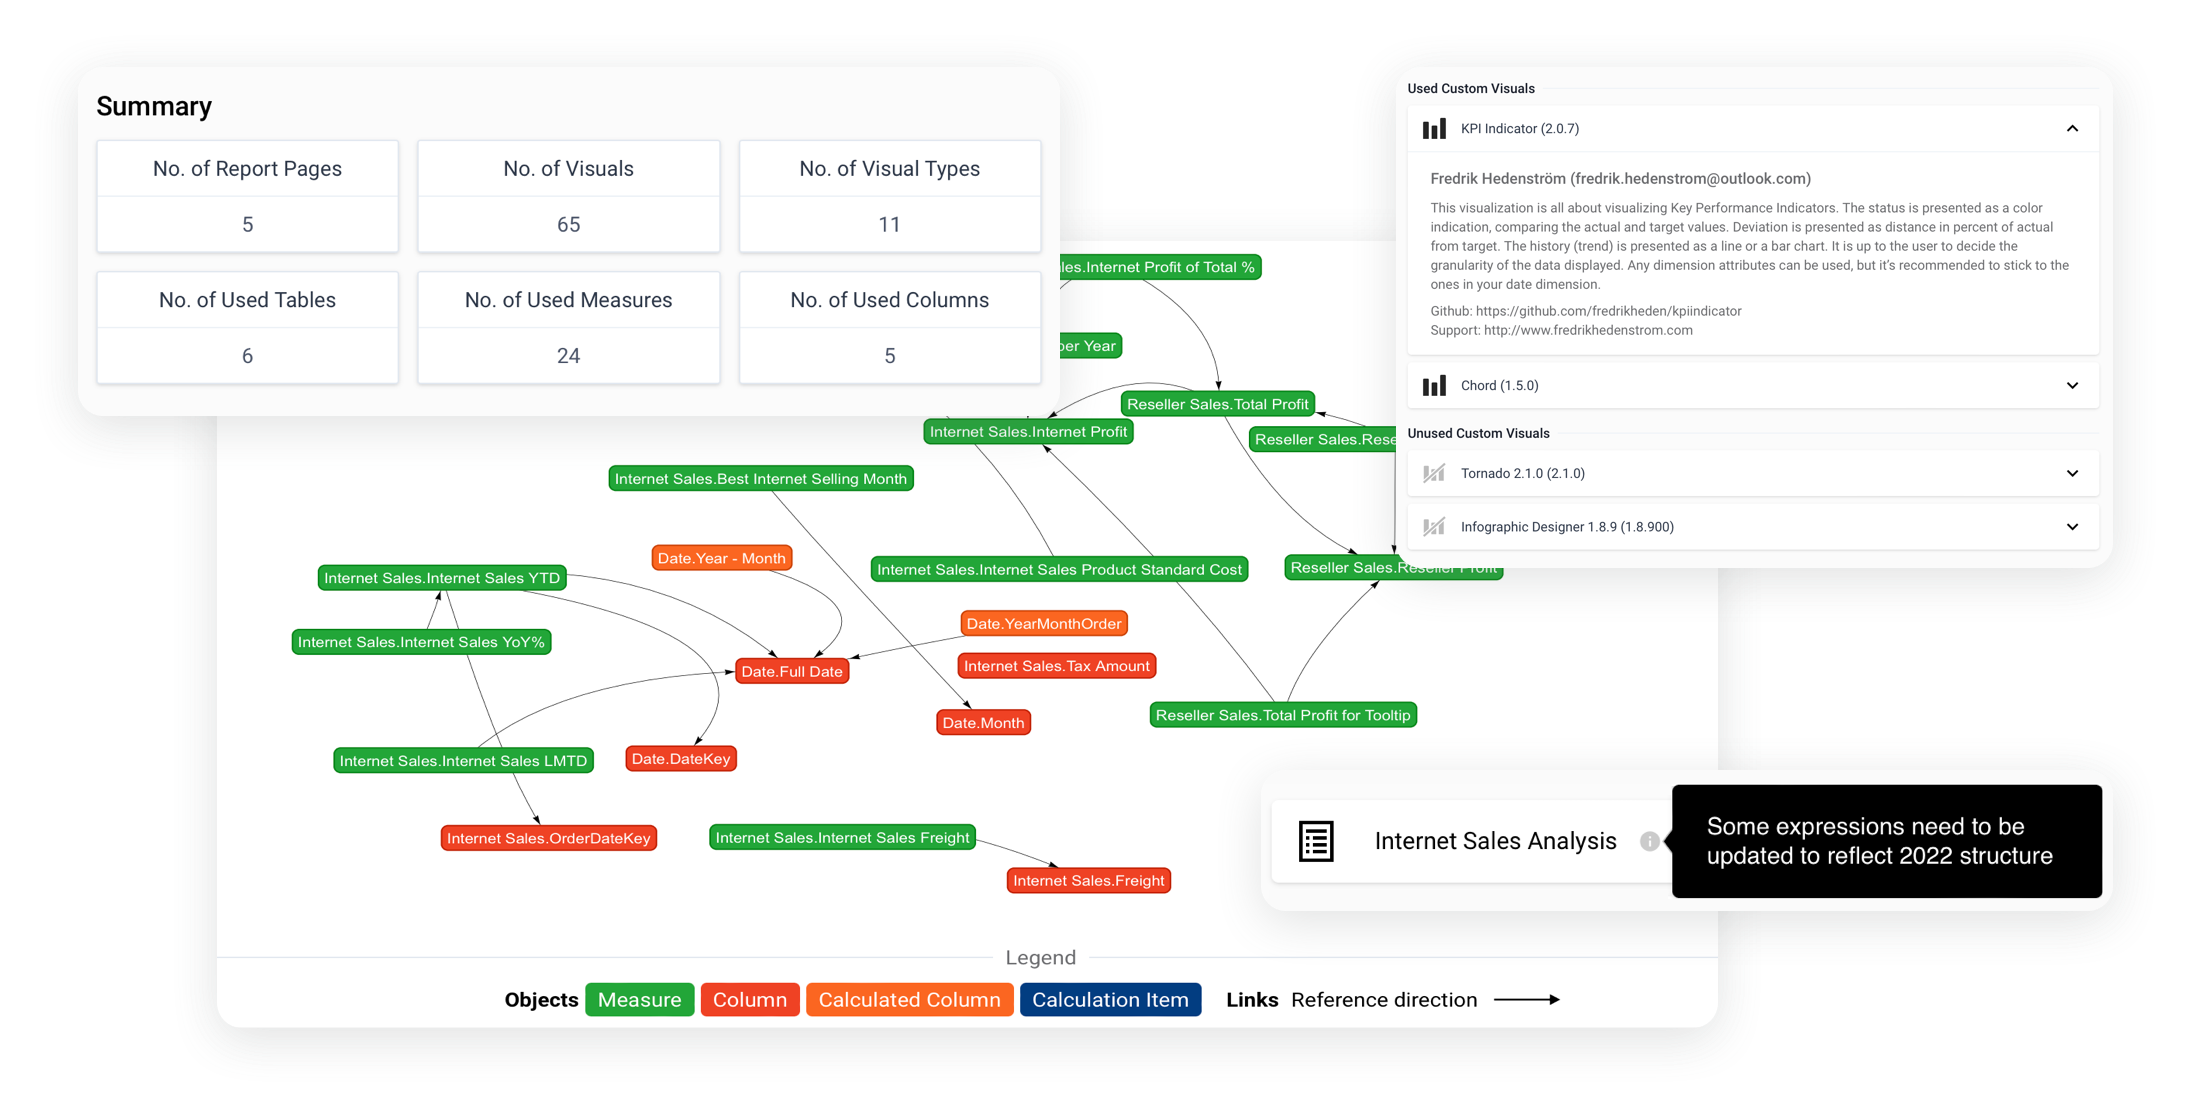
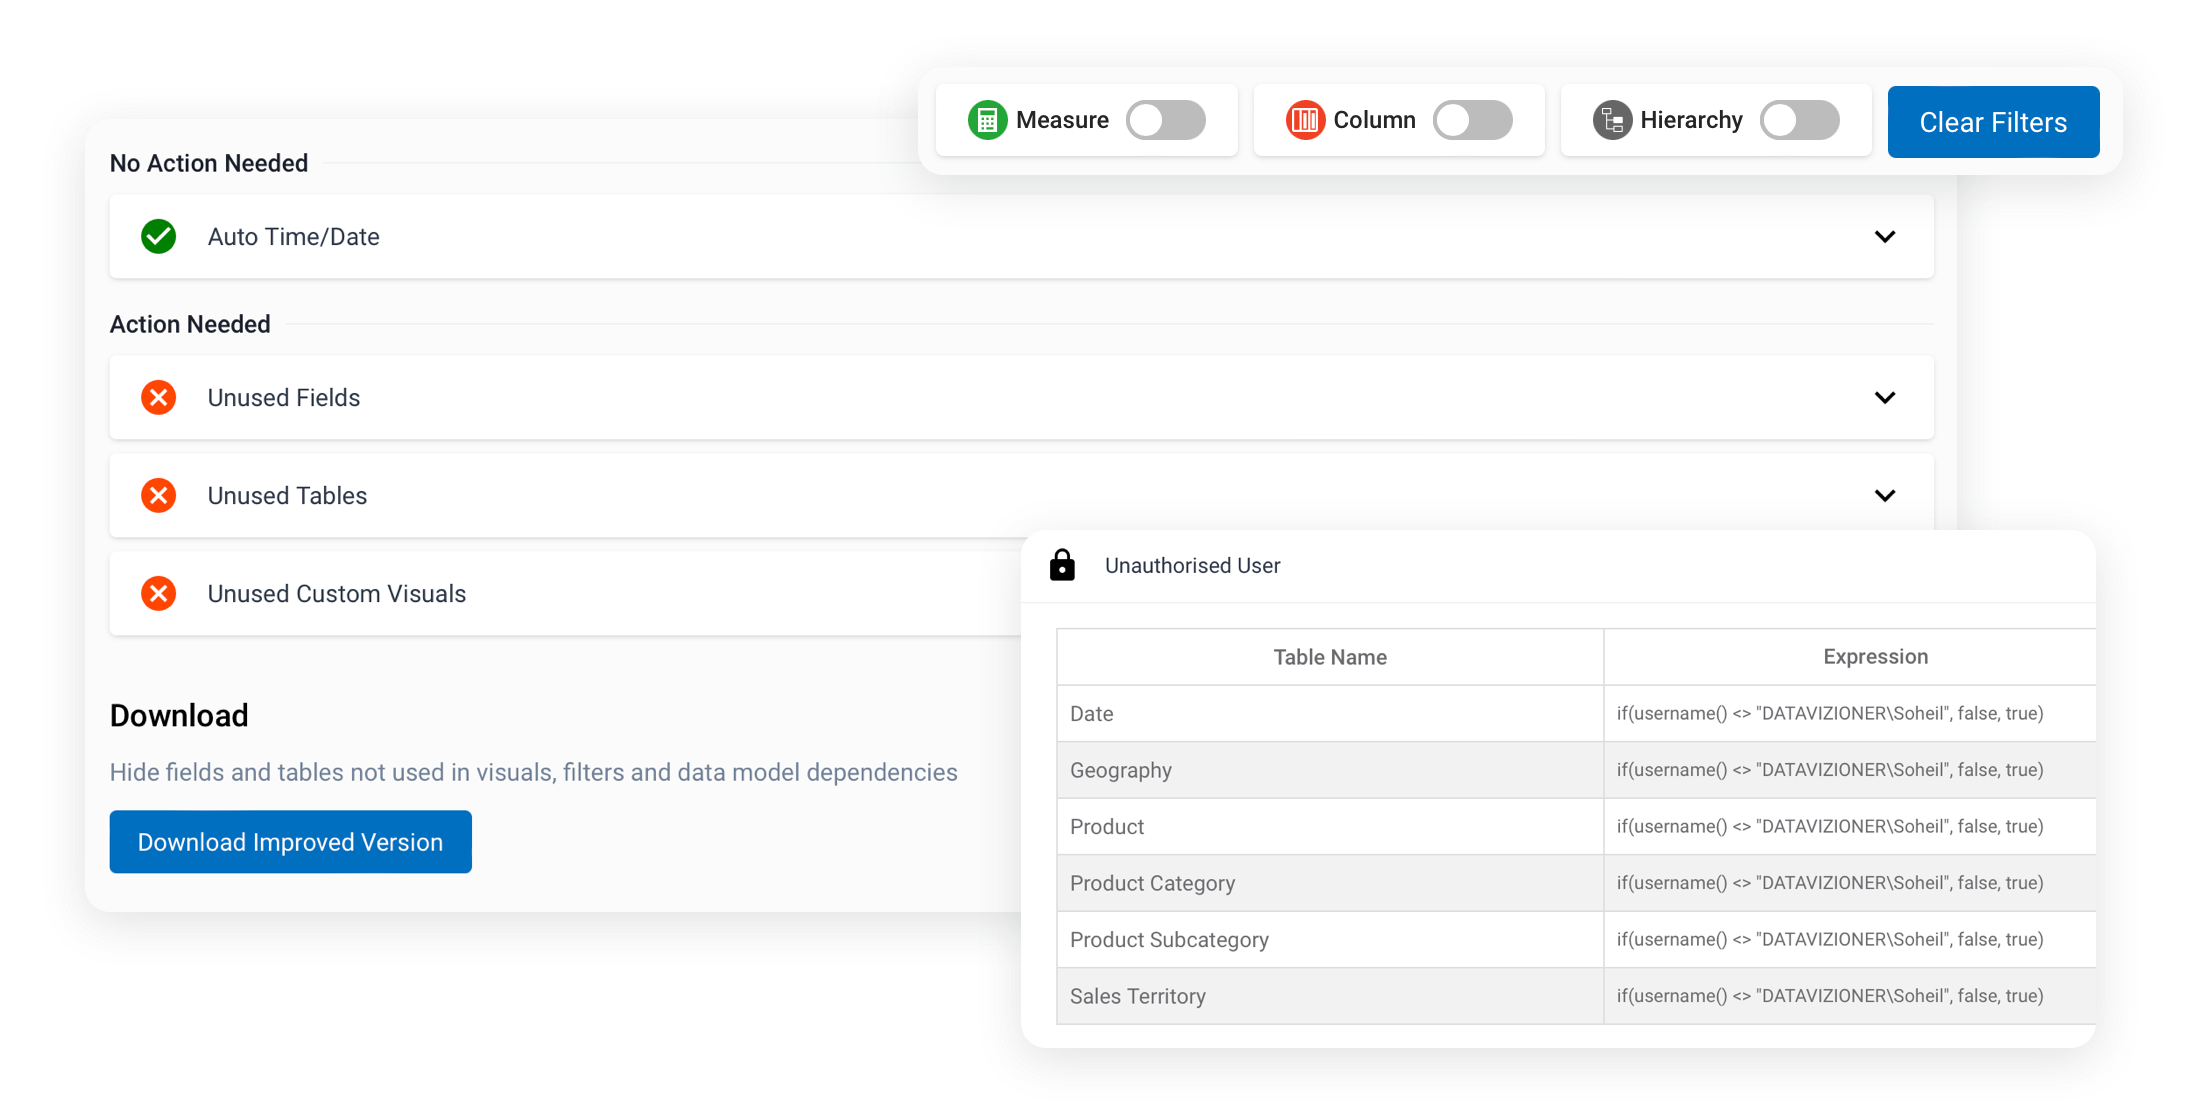
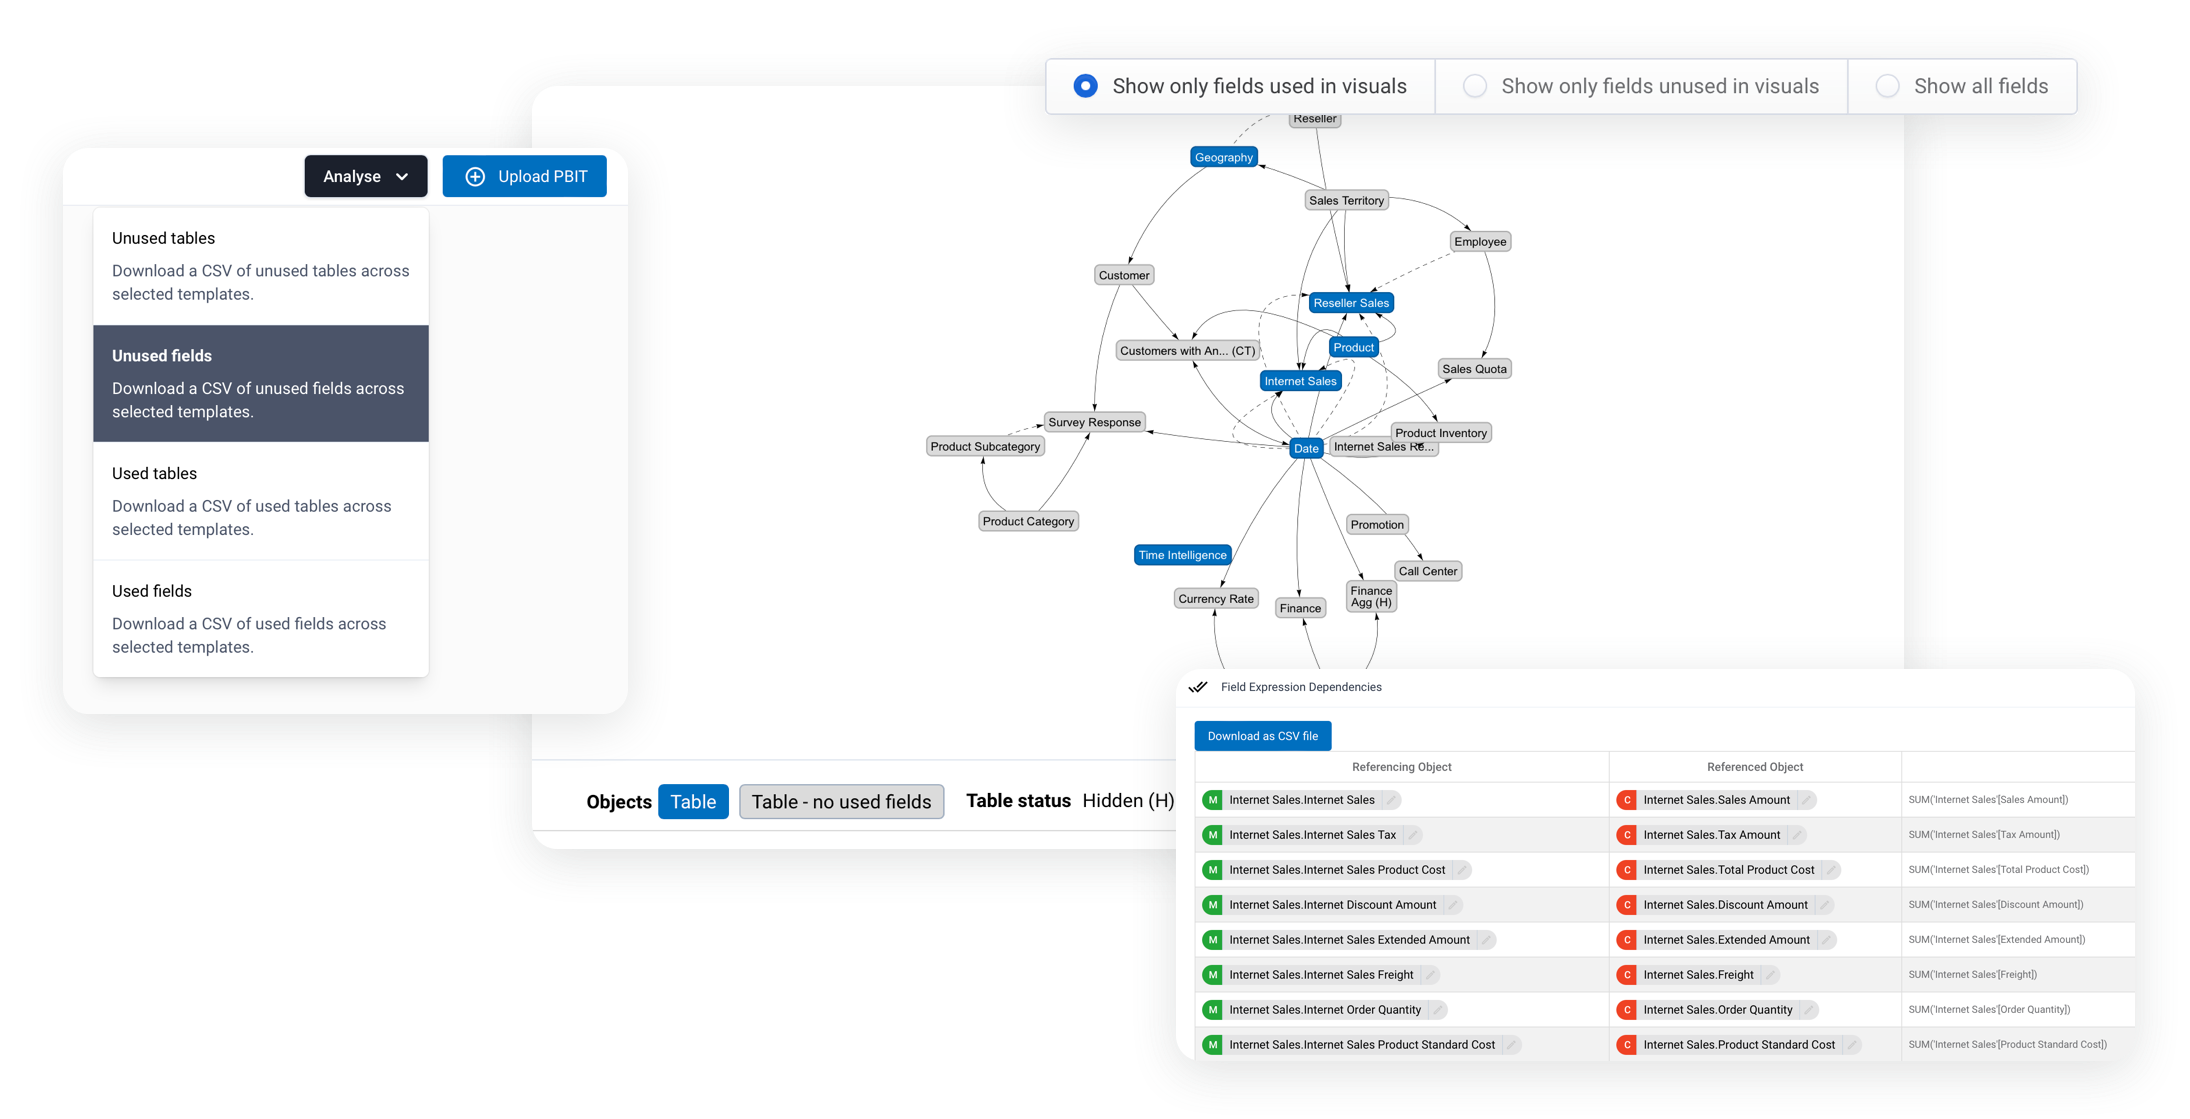
Find out how Trajan Scientific and Medical navigated growing data complexity, improving data model performance and reducing ongoing maintenance costs with the Data Vizioner data intelligence platform.

Automate documentation

Capturing contextual knowledge is essential to increasing reporting standards, productivity and accessibility across your organization. Create documentation in minutes, not weeks.
Documentation

Add descriptions anywhere

Go beyond Power BI's built-in descriptions, with the ability to add narrations to visuals, fields, pages and much more. Use these for inline documentation, or as the foundation for more traditional documentation.

Capture your analysis

Whether you're creating documentation in Word, Confluence or somewhere else - easily screenshot and capture key details to help explain how your reports and datasets function.

Activate your 7-day trial

Simply create an account and invite your team to get started, or book a time to talk.

BOOK AN INTRODUCTORY CALL

Tell us about some of the challenges you're facing, and see if Data Vizioner is the right fit.