Blog
Microsoft Fabric: The Data Platform for the Era of AI
New end-to-end, unified analytics platform brings together data and analytics tools - along with new data governance challenges.
Data Vizioner helps Trajan navigate growing data complexity, improving data model performance and reducing ongoing maintenance costs.
Trajan Scientific and Medical enriches human well-being through scientific measurement. A global developer and manufacturer of analytical and life sciences products and devices, Trajan employs a global workforce of more than 300 people with operations in Australia, Europe, the US and Asia.
Through their portfolio and technology pipeline they are supporting the move towards decentralised, personalised data-based healthcare, focusing on emerging technologies that deliver the greatest benefit to society.

As one of Australia’s leading biotech companies, Trajan has grown rapidly since it was founded in 2011. In recent years, growth has involved acquisitions to bring in specialist capabilities and commercialisation of emerging technologies.
With this comes increasingly complex data across different products and regions, and the need to make data more accessible and actionable across the whole organization.
Increasingly leveraging data to support its scientific work and make key business decisions, like most organizations with growing data complexity, Trajan is on a journey. With enterprise level requirements, rolling out Power BI out across the organisation was a key stepping stone to taking advantage of the vast array of data on hand and build a data driven culture.
Specifically, Trajan approached Data Vizioner with two key challenges. They needed to:
Increase the performance of their data model, which was no longer coping with the growing complexity of information efficiently; and
Start building a data dictionary to make it easier to identify the purpose of each field, and how it should be used.
“As any business grows, it’s important to be constantly looking for opportunities to leverage data more effectively across the company. This means understanding your model, and enabling others to use the data effectively in their reports. Data Vizioner helped us to address this challenge.”
– James Orgill, Global IT Operations Manager
Operationally, solving these challenges would improve efficiency and mitigate risks today; strategically it would unlock the next step on a journey to enabling people throughout the business to seamlessly create their own reports, knowing that they can trust the data they are relying on to make important decisions.
Having moved from Excel spreadsheets to Power BI and resolved challenges around filtering their data for the right groups of people, adopting the Data Vizioner data intelligence platform was a natural next step for Trajan.
The first step for both challenges faced was to identify which tables and fields were being used, and which were not. This would allow Trajan to trim their model and remove tables and fields that no longer served any purpose. However, this is no easy task when you’re dealing with dozens of reports, especially if you have to check and reconcile each manually.
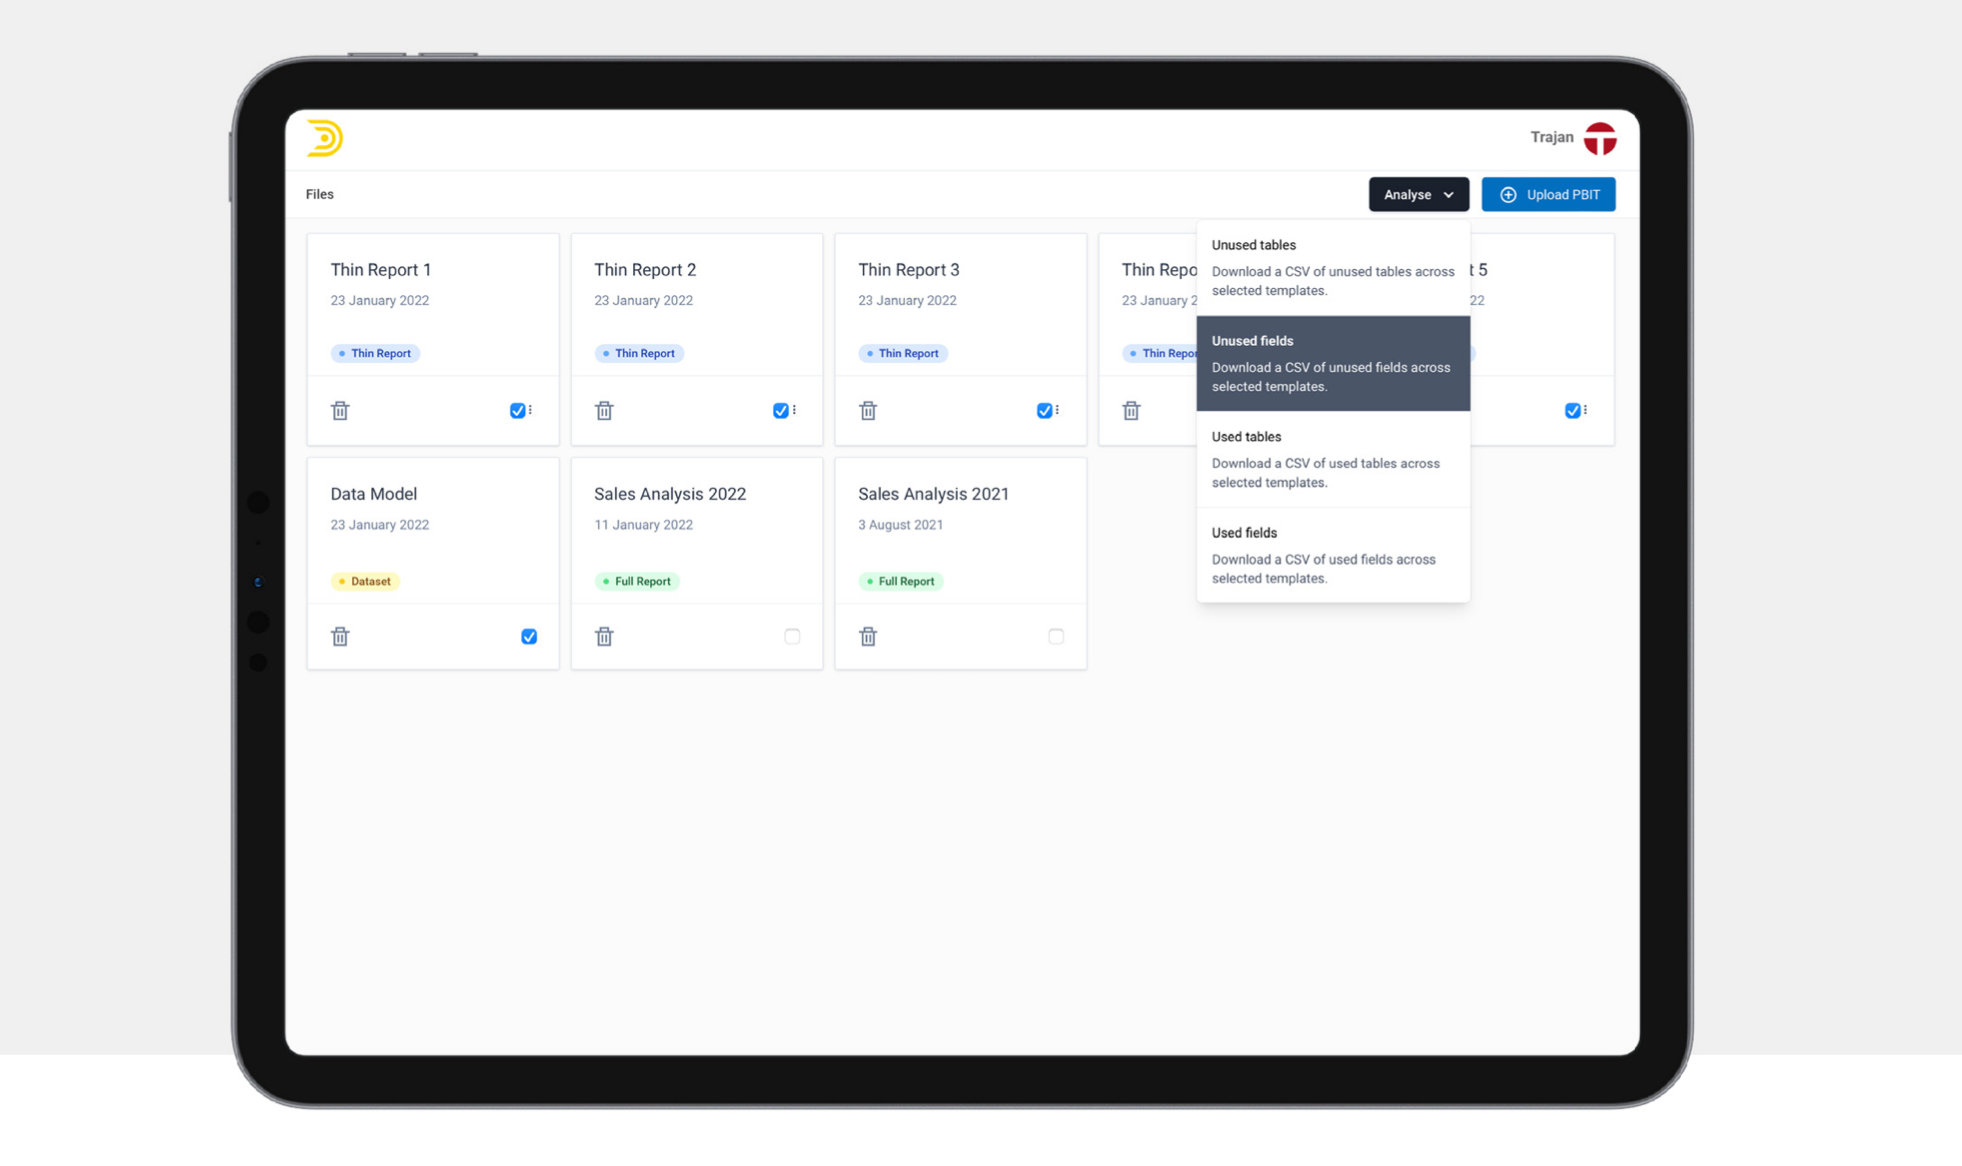
Data Vizioner was able to provide an add-on module that simplified the entire process down to a click. To identify used/unused tables and fields across multiple reports, Trajan simply needed to select the model and related reports, and then use the Analyse menu to export a CSV containing a detailed list of tables and fields to action.
“We smiled when we first saw the Data Vizioner platform. While there is still some manual work to do, we could see that it would get us 80% of the way there which was ground breaking compared to alternatives we had been considering. Not only that, it has also provided lots of learning opportunities along the way.”
– Janet Nixon, IT Systems Analyst
Working with Data Vizioner has helped Trajan to better understand their data, where it is coming from and accelerated their journey towards organization wide usage of Power BI.
|
Improved performance |
|
Reduced manual processes |
|
Better visibility |
| Move from SQL Server to Azure Analysis Services | 2 days to less than 2 hours = 80% reduction in time |
Efficiencies gained, 80% the way to data dictionary | |||
By trimming down their model and getting better visibility around which tables and fields are actually being used, they are able to answer questions from the business more accurately and reduce the overall cost of managing and maintaining their model.
But perhaps most valuable for the team themselves, the previous more cumbersome processes are no longer competing for priority and the job gets done consistently every month, reducing the amount of manual processing from 2 days to less than 2 hours every month.
The team at Trajan knows that Data Vizioner has their back and is ready to help as they continue their journey. They are empowered to control their data destiny.
The team at Trajan Scientific have put the Data Vizioner platform through its paces and have been delighted with the value it adds.
Are you ready to improve data intelligence within your organisation? Download and share the case study with colleagues.

New end-to-end, unified analytics platform brings together data and analytics tools - along with new data governance challenges.
The new release of Power BI Documenter helps you with data modelling best practices, along with new feature for model analysis.
Data Vizioner is entering its next phase of growth with a new brand identity, a growing user base and an exciting pipeline of new features.