Company News
Introducing Power BI Documenter
This post takes you through everything you need to know to start documenting, reviewing and improving your Power BI reports more effectively.
Last year was a phenomenal year, and what better way to kick off 2020 than with a bunch of new features.
Last year was a phenomenal year, and what better way to kick off 2020 than with a bunch of new features (including relationships and dependancies) to make your life easier as you document your Power BI reports.
The Power BI community continues to grow, and with it we continue to evolve and challenge ourselves to deliver more for you, the users of Power BI.
Power BI Documenter can decrease the time and effort you put into documentation by up to 90%. In a recent example, we found that a fairly complex Power BI report could be documented in about 4 hours. The same report without Power BI Documenter would easily take 5 full days.
Keep reading to find out about all the new amazing features that have been added to Power BI Documenter since our last update.
As mentioned earlier we added some new cool features to Power BI Documenter. As well as refining the UI, we heard your voice and introduced two of the most wanted requested capabilities.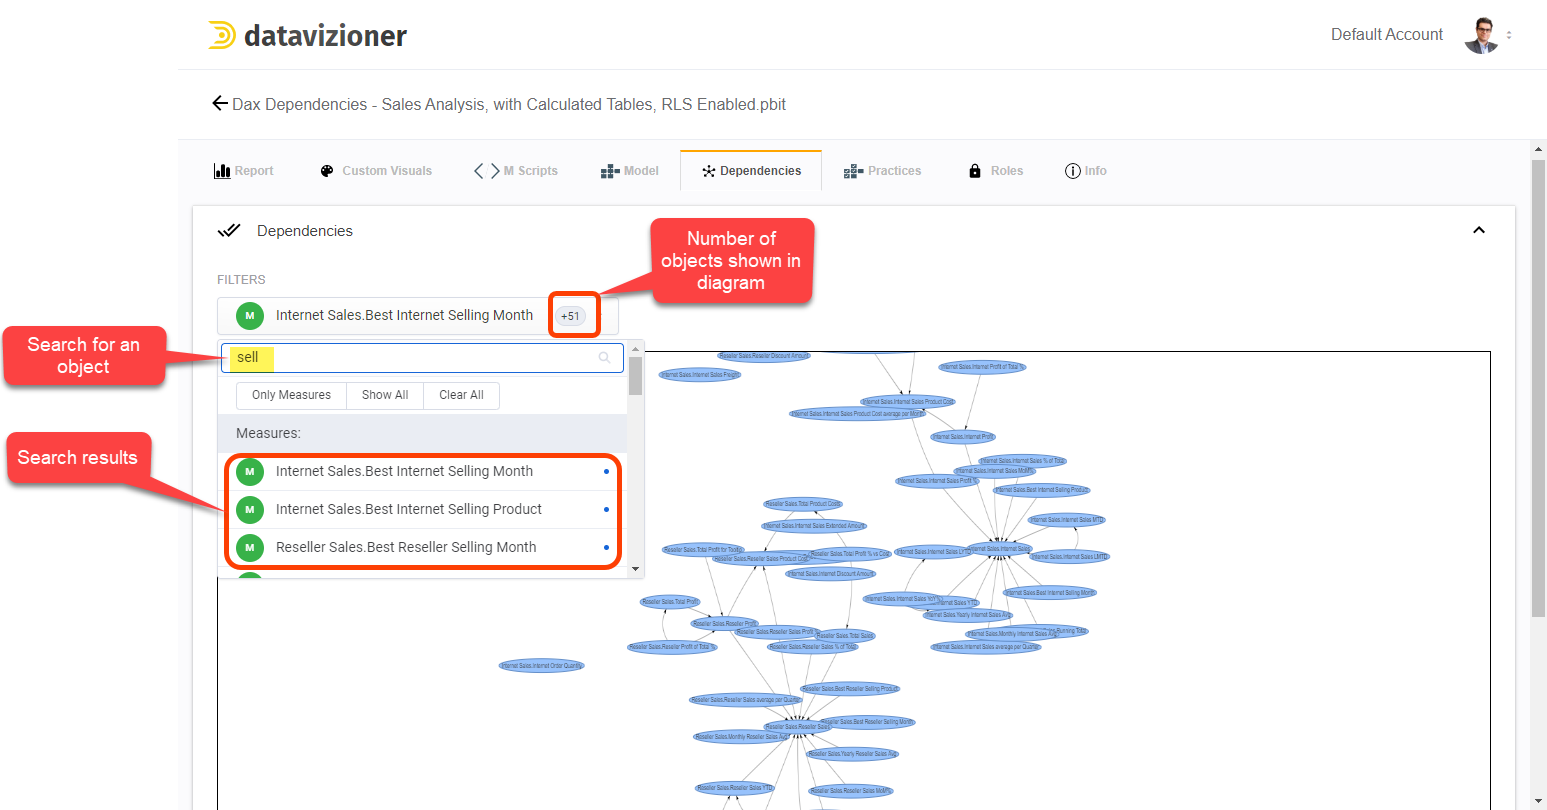
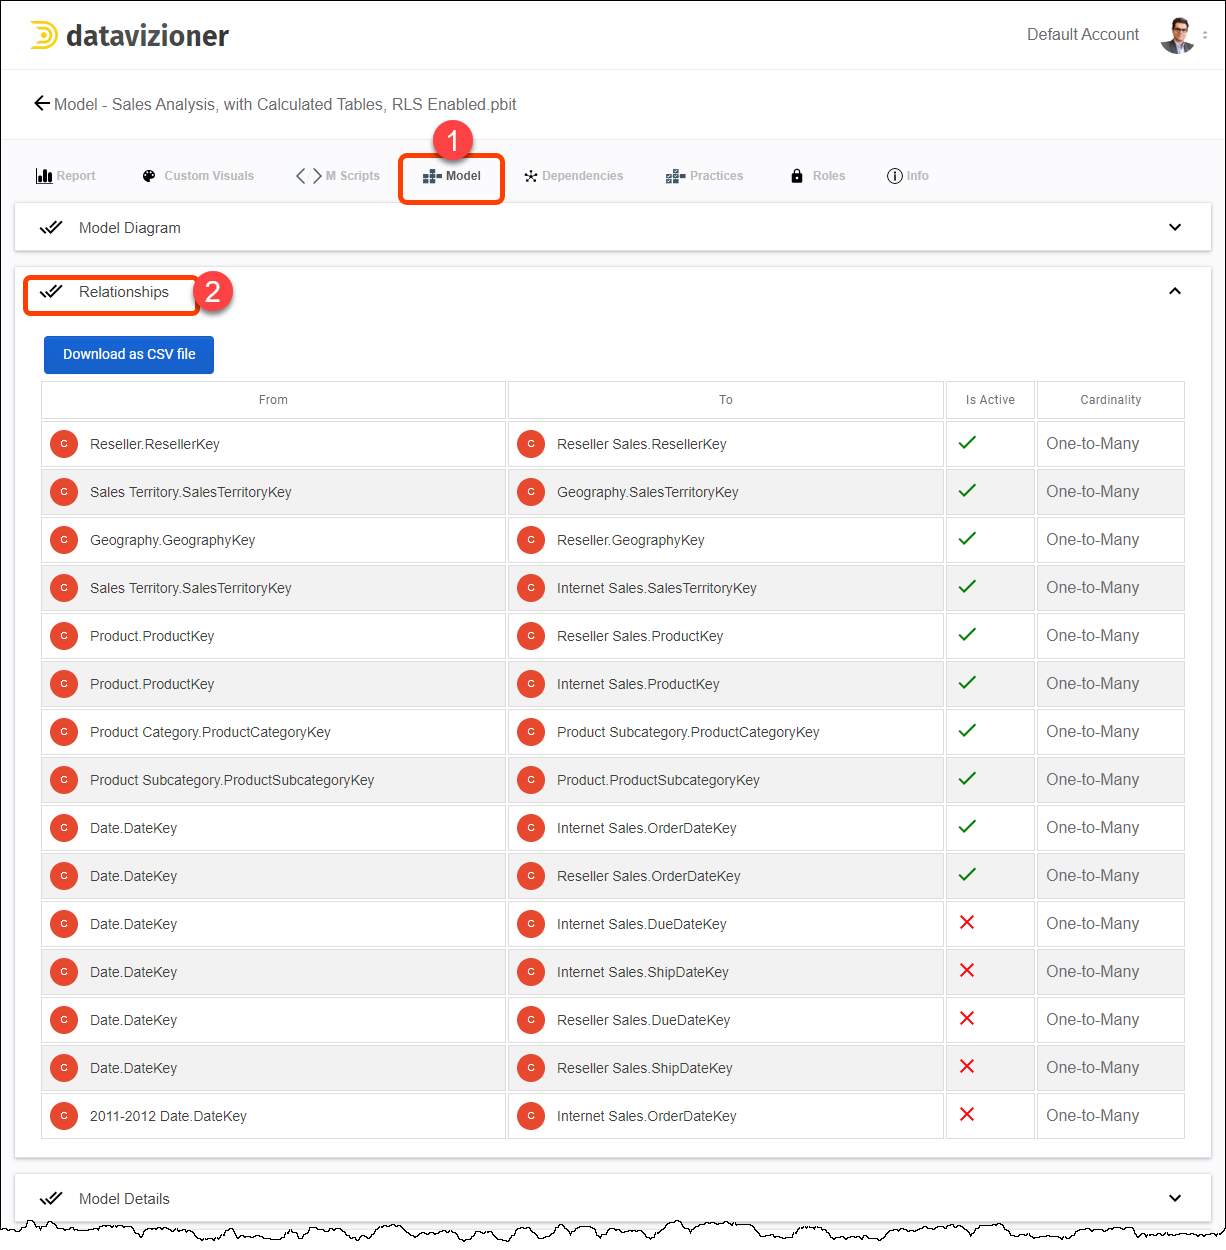
You asked for it we delivered the feature. Adding “Relationships” to “Model” tab was one of the most requested features in 2019. You can now easily see and download entity relationships from “Relationships” section in “Model” tab.
You can find out the following in the “Relationships” section:
The other key feature you asked for was DAX Dependencies. This was a quite challenging and complex feature to implement. But we made it for you. Honestly, this is one of the coolest features we ever implemented in Power BI Documenter – tell your colleagues to check it out!
For some of you who don’t quite know what this feature is all about, it is to identify if an object in your data model is dependent to any other objects. For instance, you have a calculated column that used a measure in its DAX definition. If for any reason you delete that measure you break the dependent calculated column. Now imagine if there is more than just one calculated column dependent to the deleted measure, then deleting that measure is a big mistake.
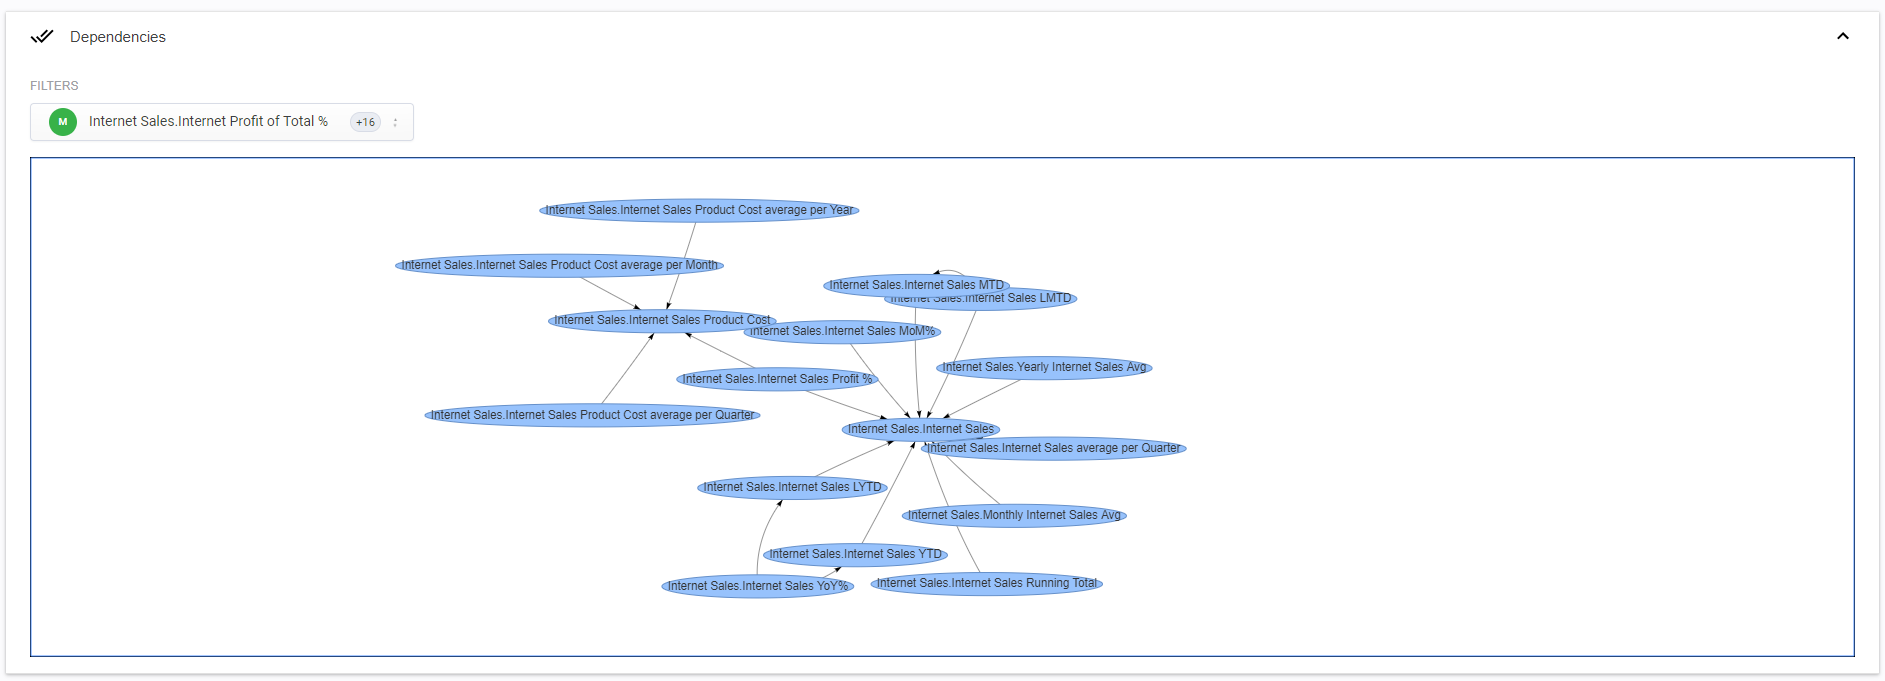
Here is a sample of how your DAX expressions may depend on other expressions. The following diagram shows how other measures are related to “Internet Sales” measure.
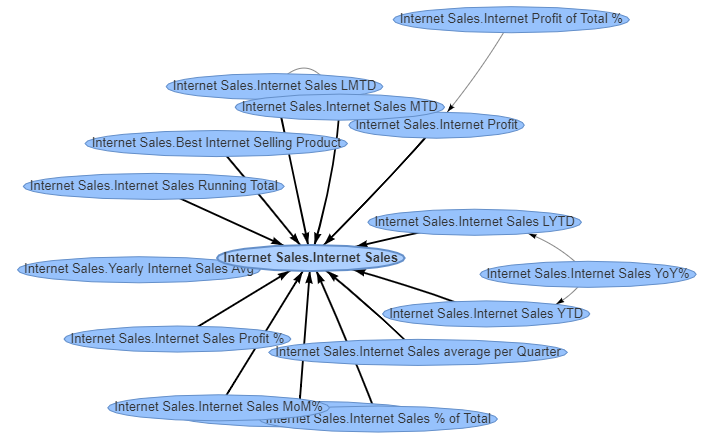
As you can see in the above diagram should you need to make any changes in the “Internet Sales” measure that change potentially affects all dependent measures.
Using the new “Dependencies” feature is quite easy. We added a new specific tab for it. Simply click the “Dependencies” tab and you’ll see the following drop-downs available for you:
This section give a graphical view of the dependencies in your model. The default view only shows measure dependencies, but you can select any other objects from the filter to add/remove any other objects. The following objects are available to filter:
We also made some predefined filters available for you to select as below:
You can also search for an object to add/remove to/from the diagram.

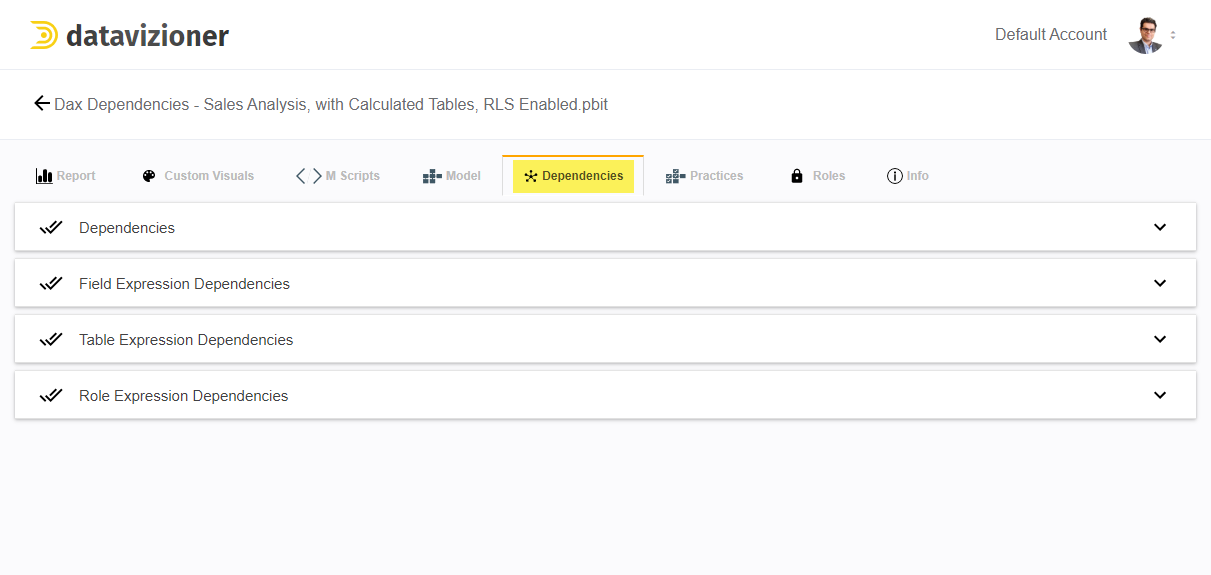
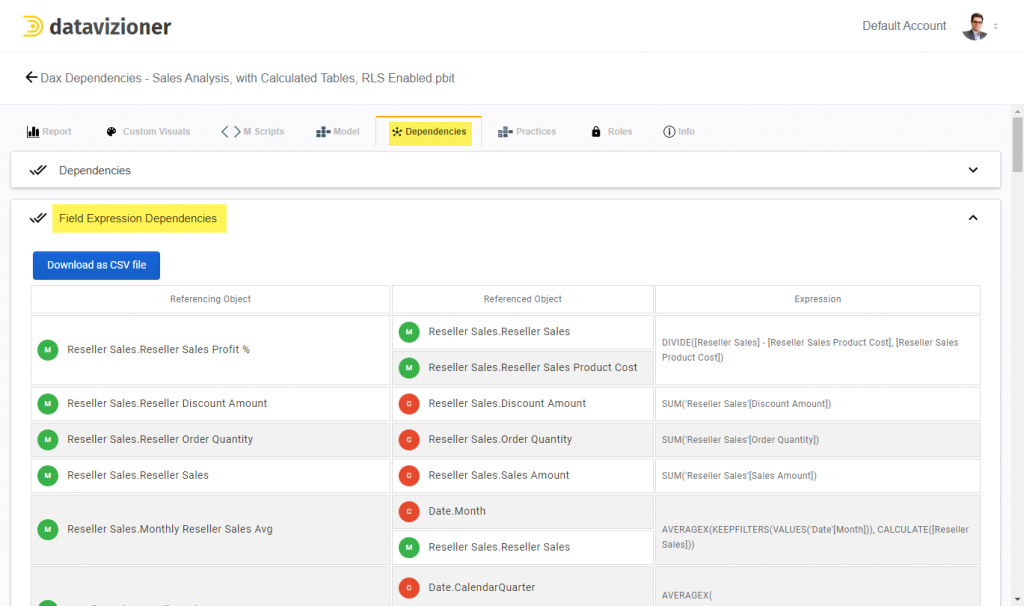
This section shows all field expression dependencies in your Power BI model. Field expression dependencies include dependencies between measures, calculated columns and columns. The table shows “Referencing Object”, “Referenced Object” and “Expression”. You can also download a copy of “Field Expression Dependencies” in CSV format.
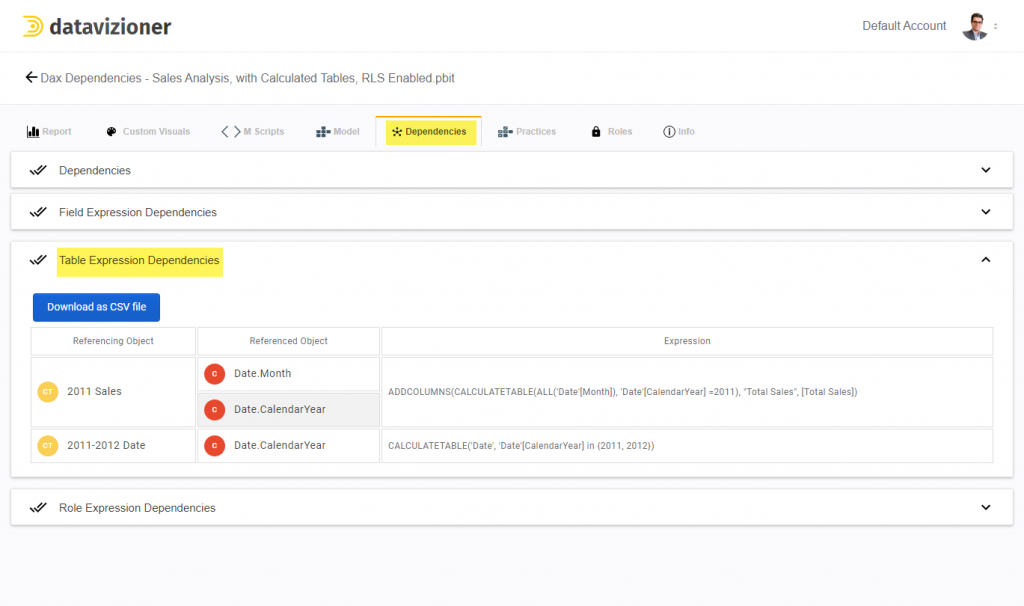
If you have created any calculated table in your model you’ll find out their dependencies in the “Table Expression Dependencies” drop-down. As always, you can easily download a CSV version of the dependencies.
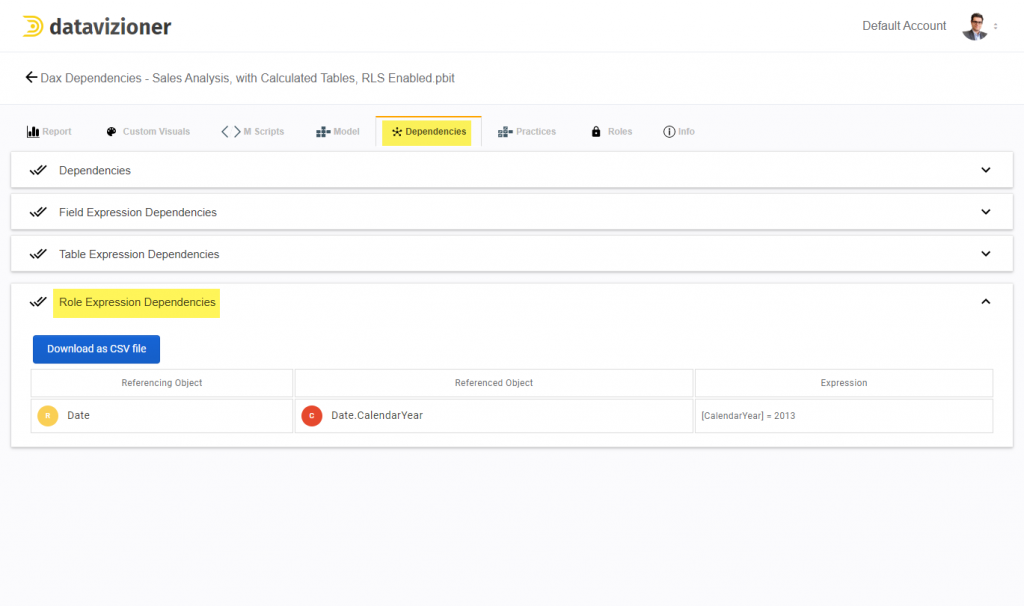
Last by definitely not least in the dependencies section is “Role Expression Dependencies” which analyses DAX expressions used in RLS (Row Level Security) and shows the dependencies in a table. Again you can download the list of dependencies in CSV format.
When you’re using an app day in, day out a great user experience not only makes your work more enjoyable, but it also boosts productivity and reduces the chance of mistakes.
We regularly ask for product feedback from users, and the insights we gather lead to better product decisions. Below are some of the changes we’ve recently rolled out:
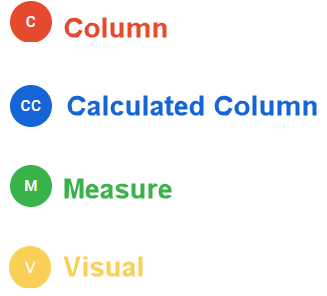
In December, we unified the colour codes and abbreviations used across Power BI Documenter. The following abbreviations are used and will be used across the tool:
| Abbreviation | Colour Code | Full Phrase |
| C | Red | Column |
| CC | Blue | Calculated Column |
| M | Green | Measure |
| CT | N/A | Calculated Table |
| H | N/A | Hidden Object |
| V | Amber | Visual |
Icons Used:
We identified that the old arrangement of tabs in Power BI Documenter wasn’t intuitive enough. So we rearranged them so that you can get the same information and insights about your Power BI reports easier.
The new tab arrangement is as below:

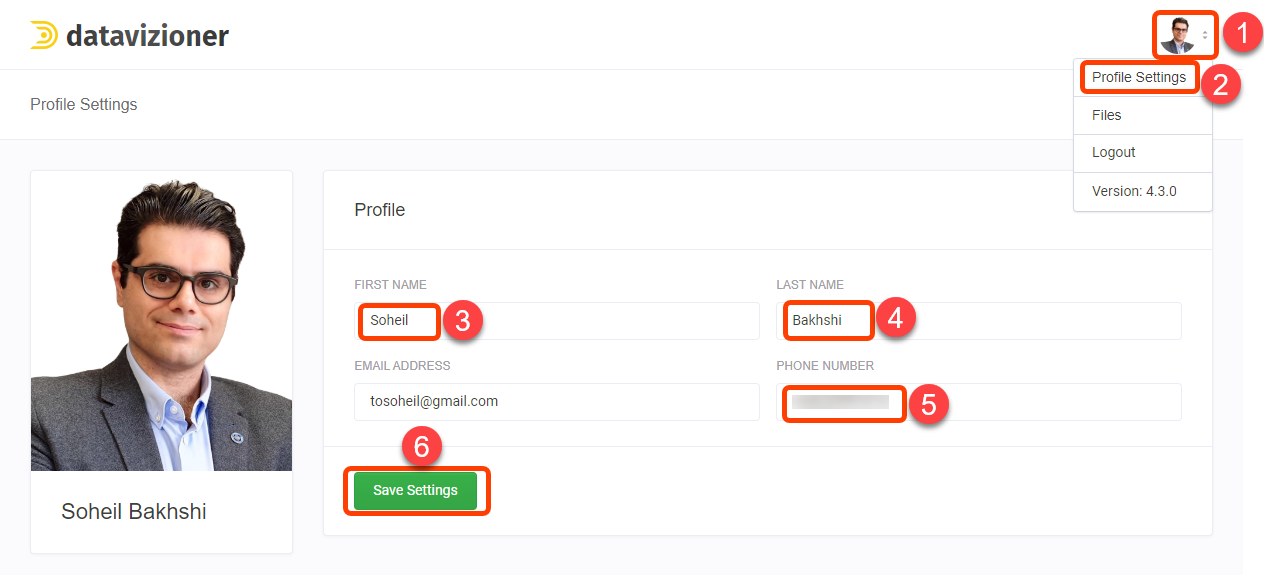
As we build out the Data Vizioner platform your profile, and the people you work with are becoming increasingly important. As a first step we’ve given you the ability to update your profile to better reflect you.
You can now modify the following information:
To change your profile click on the menu on top right of the page and select “Profile Settings”. Then make the changes and click “Save”.
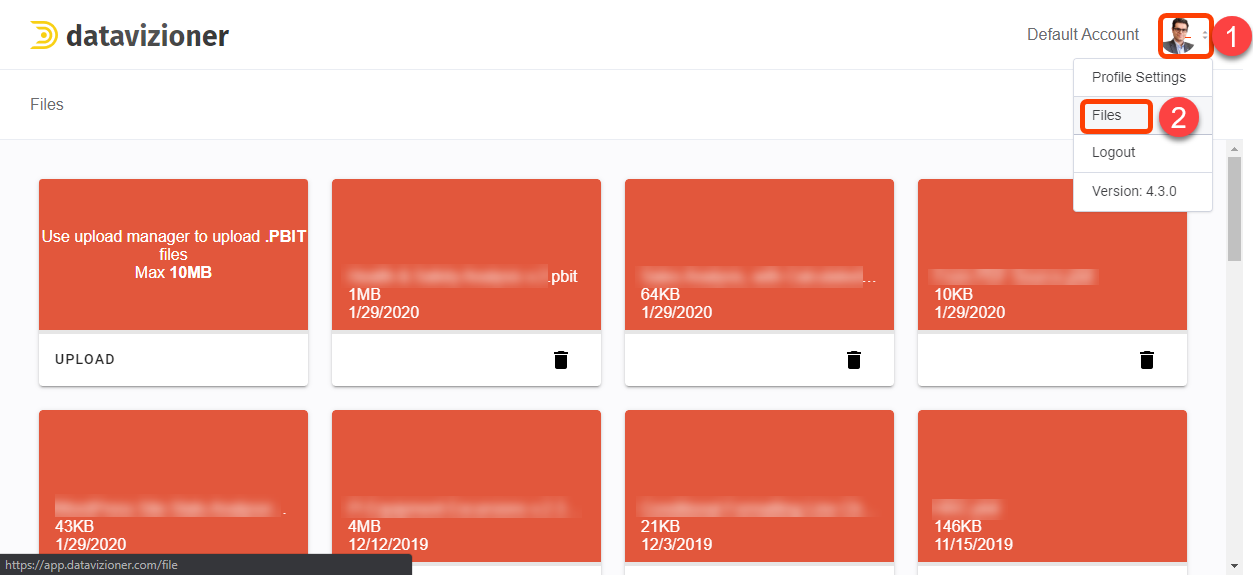
To go back click menu again then click “Files”.
This is the first step in a wider roll out of account functionality to support multiple users on the same account, and a more collaborative workspace.
We hope you enjoy using Power BI Documenter and the new features that have been rolled out over the past couple of months. 2020 will be an exciting year with lots of updates planned, so stay tuned.
This post takes you through everything you need to know to start documenting, reviewing and improving your Power BI reports more effectively.
In the new release you’ll get tons of new features that help you with improve handover processes and make them much easier and more effective.
The new release of Power BI Documenter provides lots of new information about your Power BI reports along with one more best practice.