Product Updates
Power BI Documenter October 2018 Release
The new release of Power BI Documenter provides lots of new information about your Power BI reports along with one more best practice.
The new release of Power BI Documenter comes with new fascinating features that makes your lives even easier on your day-to-day Power BI engagements.
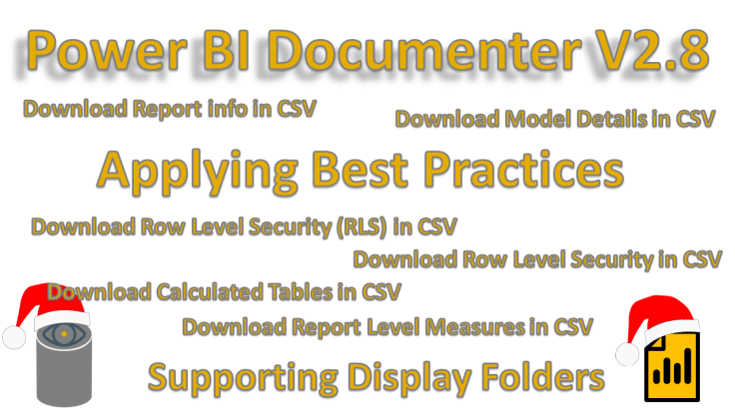
We’re excited to announce that Power BI Documenter V2.8 (December 2018) has been released for public use. The new release of Power BI Documenter comes with new fascinating features that makes your lives even easier on your day-to-day Power BI engagements. We, at Data Vizioner, recognise the pain points for Power BI professionals who are involved with Power BI development, code reviewing, auditing, documentation and handover. This release would be our last one in 2018 so we added some of the most wanted and compelling features to the tool to be given away as our Christmas present to all of our users. We would like to take this opportunity to thank all of you for using Power BI Documenter and giving us your invaluable feedbacks during the past 6 months. During this time, we hit the 1,000 users milestone which is amazing.
Power BI Documenter 2.8 comes with amazing new features that can help individuals and organisations with their Power BI engagements:
This feature was the most wanted feature our users asked for. We heard your voice. From December 2018, you can download all information that appear in data grid format across the Power BI Documenter in CSV format. Currently you can download the information from the following sections:
When you login to Power BI Documenter you land on “Report” tab by default. On the “Report” tab you see all general information about related to the uploaded Power BI report.

This tab includes statistical information on top and more detailed information in data grid format at the bottom when you scroll down. From now on you can download data grid contents in CSV format. This is very useful when you want to include those information in you offline documentation.
Note: The filters affect the data grid information only and will not affect the CSV contents.
Here is how the downloaded file looks like:
When you click on “Model” tab, you can see different views based on the “Connection Mode” of your Power BI file. If the Connection Mode is “Data Import” then you’ll see the following sections.
Graphically represents your model relationships and usage in visuals. This part can NOT be exported at this stage.
Provides detailed information about your model including Columns, Measures and their attributes like if they are hidden or used in visuals. When you expand this section you’ll see a “DOWNLOAD AS CSV FILE” button within this section. By clicking on that button you can download the contents of the “Model Details” section in CSV format.
Note: The filters affect the data grid information only and will not affect the CSV contents.
Provides more detailed information about the Tables and their attributes like is table hidden or if it is calculated table. Click on the “DOWNLOAD AS CSV FILE” button to download the contents of the “Table Details” section in CSV format.
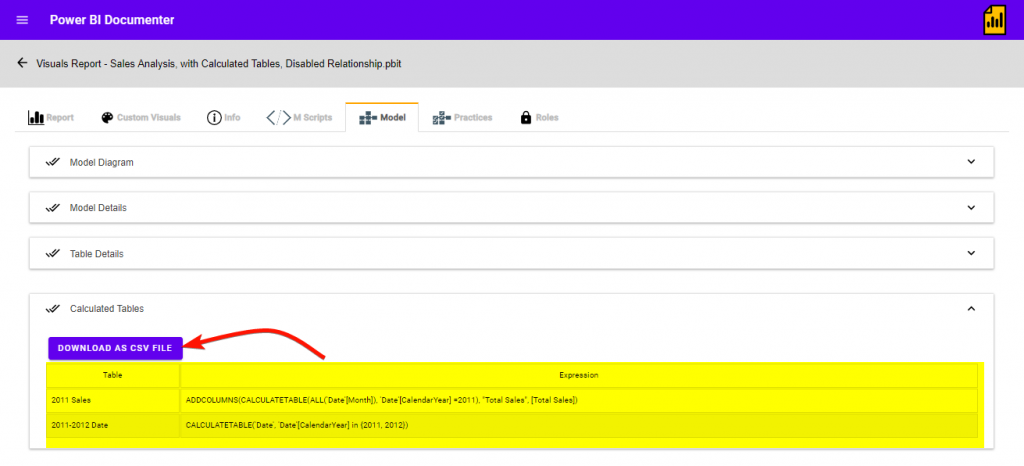
Provides calculated tables with their corresponding DAX expressions. Click on the “DOWNLOAD AS CSV FILE” button to download the contents of the “Calculated Tables” section in CSV format.
When you Connect Live to an instance of SQL Server Tabular Model, you have the ability to create report level measures. This is an awesome feature. The problem is that when you connect to an instance of Tabular model from Power BI Desktop, when you create new Report Level measures, those measures will get lost between many other measures that already defined in the Tabular model. Currently in Power BI Desktop the only way that you can find Report Level measures, is to click on the measure, if the formula bar appears then you can see the DAX expressions used to create the measure. With Power BI Documenter, you can simply upload your PBIT file to Power BI Documenter, then click “Model” tab, then from there you can see and download all DAX formula used to create the Report Level measures.
Note: The filters affect the data grid information only and will not affect the CSV contents.
If there is Row Level Security (RLS) setup in your Power BI file, it is good to include it in your documentation. To download the RLS information click “Security” tab then click the “DOWNLOAD AS CSV FILE” button to download the contents of the “Row Level Security (RLS)” section as CSV file.
This feature was in our wish list for a while. We are very excited to announce general availability of this feature. You can now apply two best practices to your model and download the file accordingly. The two best practices are:
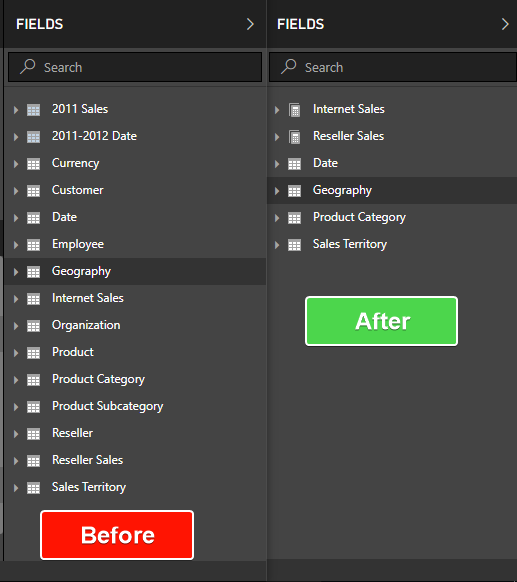
In lots of cases Power BI developers just fully import all tables at the first place to have everything available in their reports. Then they use some columns in visuals and leave all unused columns and tables visible. Or in some cases you may define a lot of measures while not all of them are used in the visuals. Despite the fact that this is not best practice, in real world, lots of developers do that. It is not like they don’t know about the best practice. In majority of cases we see the developers left the model as is when the project budget is tight and it is really time-consuming to find out which columns or measures are not used in visuals without any tools like Power BI Documenter. The issue doesn’t stop there. After you find out the unused objects, now you have to go and hide all the unused ones which is laborious.
We recognised this issue so we added the best practice section to the August 2018 release of Power BI Documenter. In the December 2018 release, we apply the above best practices to your Power BI Model and make the improved PBIT file available for download. So from now on, you can simply upload your PBIT file, then click “Practices” tab and download the file with best practices applied to it. This is really fascinating feature that can save a lot of development time and make your model more professional.
As you may guessed, this feature is NOT available when you Connect Live to an instance of SQL Server Analysis Services (SSAS).
Here is how your Power BI Model looks before and after applying best practices:
Display folders is a new feature added to the November 2018 release of Power BI Desktop. despite the fact that it is still under preview, we thought it would be great to add that feature to Power BI Documenter. To see the display folders, click “Model” tab then expand “Model Details” section. We added a new column to the data grid names “Display Folder”.
And yes, it is included when you download the CSV format.
In future releases we will add more cool stuff to Power BI Documenter like more best practices to be applied, supporting XMLA to connect Power BI Documenter to Power BI Service and more. Stay tuned.
The new release of Power BI Documenter provides lots of new information about your Power BI reports along with one more best practice.
This post takes you through everything you need to know to start documenting, reviewing and improving your Power BI reports more effectively.
In the new release you’ll get tons of new features that help you with improve handover processes and make them much easier and more effective.