Company News
Introducing Power BI Documenter
This post takes you through everything you need to know to start documenting, reviewing and improving your Power BI reports more effectively.
In the new release you’ll get tons of new features that help you with improve handover processes and make them much easier and more effective.
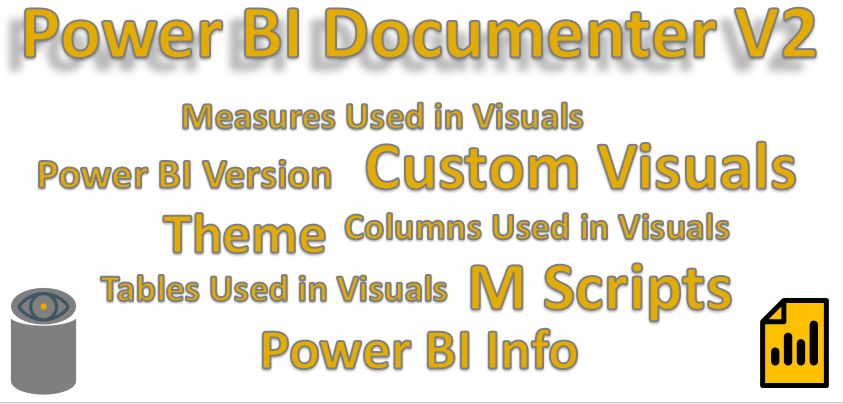
We’re excited to announce that Power BI Documenter V2 (July 2018) has been released for public use. In the new release you’ll get tons of new features that help you with your Power BI documentation, handover processes and make them much easier and more effective.
In this release we added four different categories showed in separated tabs.
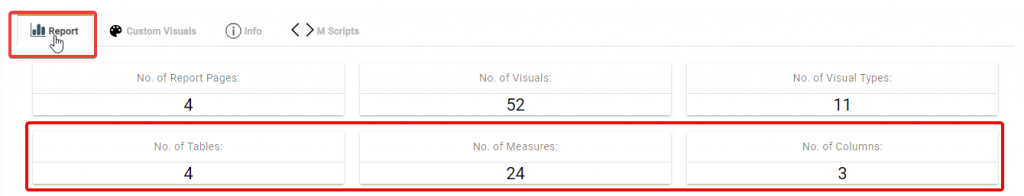
In this release we have moved the main page you used to see in the very first version of Power BI Documenter to the “Report” tab.
We also had a “M Scripts” button on the lower section of the files buttons in the “Files” page. Some of you found it confusing so we moved the “M Scripts” from buttons to new “M Scripts” tab.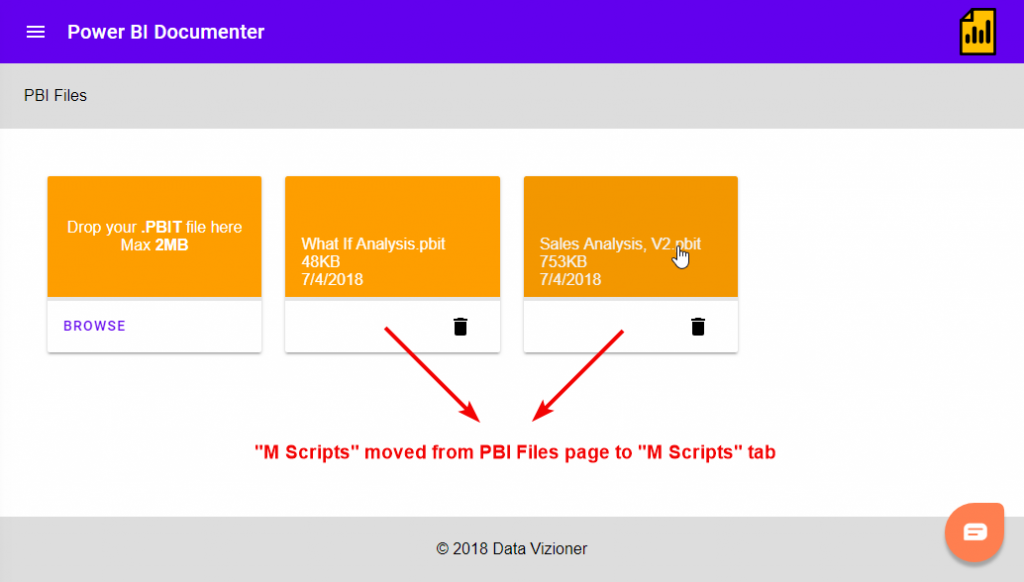
This tab include lots of information relevant to your Power BI report. In July 2018 release you see some changes in the charts and some new statistical information listed below:

This is a new feature added in July 2018 release which provides detailed information about “Custom Visuals” inclusding
New feature added to the detailed table grid which is detecting “Custom Visuals”. From now on if there is any custom visuals used in your Power BI report, Power BI Documenter detects those custom visuals and puts a link on the Visual Type. You can click on the link that navigates you to a new “Custom Visuals” tab which provides more details about the custom visuals used in your Power BI report.
Alternatively you can click on the “Custom Visual” tab to see the details of the custom visuals used in your report.
This new features available provides a bunch of exciting information about your Power BI Desktop file:
As stated earlier, we moved the “M Scripts” from “PBI Files” page to a new tab with the same name. So from now on you can see, copy the scripts to clipboard or download the scripts as text file.
This post takes you through everything you need to know to start documenting, reviewing and improving your Power BI reports more effectively.
The new release of Power BI Documenter comes with new fascinating features that makes your lives even easier on your day-to-day Power BI engagements.
The new release of Power BI Documenter provides lots of new information about your Power BI reports along with one more best practice.